New in 1.2.4 · Forge Suite

Seaglass Globe

A WGS-84 ellipsoid, in double precision, all the way down

Twenty thousand kilometres to a rooftop, in one move — no cut, no dissolve, no swapping one scene for another — the same globe the whole way down. Real elevation, real imagery, real geodesy with the algorithm named beside every number, your own data on the stack, live feeds, and compute that runs where you are looking. The optional 3D view of the Forge suite, and the surface the agent draws on.

20 000 km
→ rooftop
One continuous move — no cut, no scene swap; the same globe the whole way down
f64
all the way down
Precision held relative to the camera — world space stays double until the subtraction, so the ground stops shimmering exactly where a single-precision engine starts to
WGS-84
ellipsoid
a = 6 378 137 m · geodetic ↔ ECEF in f64 · Vincenty inverse and Karney area, named beside every measurement

The release film

Seven acts, hard cuts between beats, and no cut inside the descent: the Earth, a real coordinate system, your data, compute on the globe, scale, the world live — with the digital twin as its last demonstration — and the close. Every panel, readout and credit strip on screen is the application's own, and every number a viewer could re-verify is one the render is displaying itself.
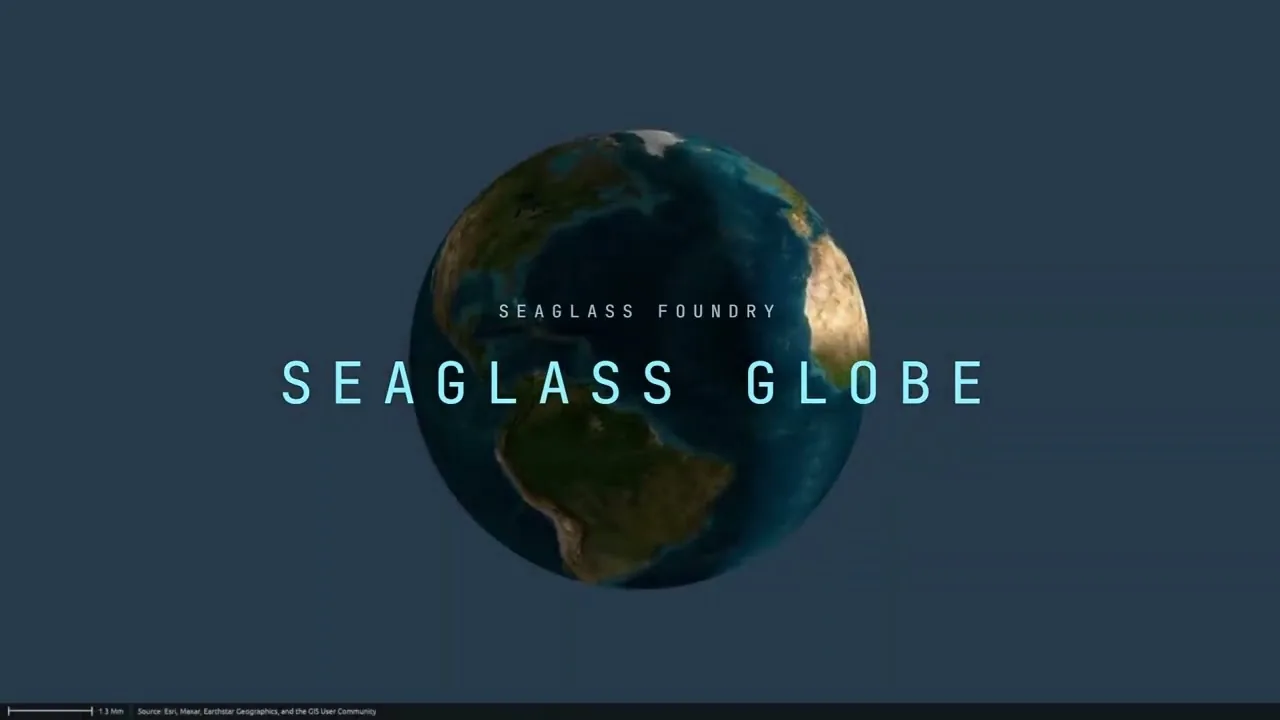
What you're watching — 5:09

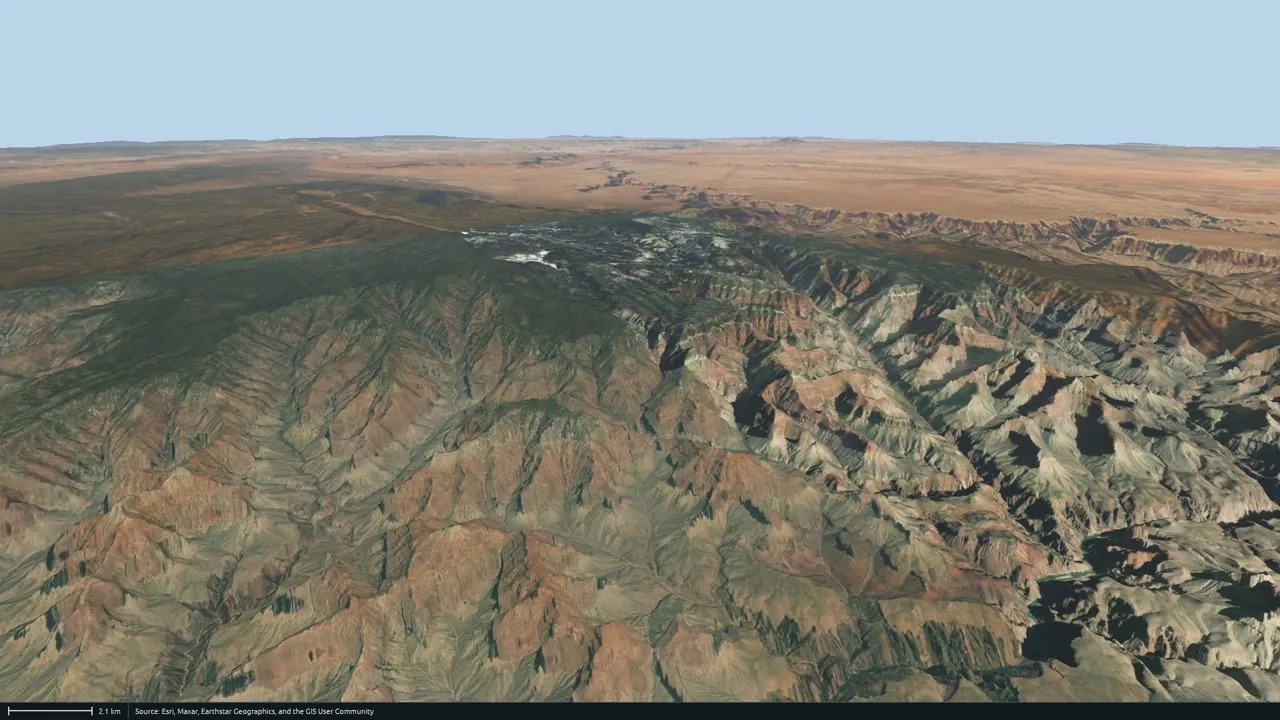
  • Act I — the Earth. Twenty thousand kilometres to a rooftop, at native speed, no cut. Terrain that doesn't stop at the waterline; a canyon whose shadows are where the depth is.
  • Act II — a real coordinate system. New York to Los Angeles bows north, because on an ellipsoid that is the short way. Two clicks and the answer names its method — Vincenty (WGS-84); close a polygon and the badge flips to Karney. The same point as DD, DMS, UTM and MGRS. Four projections of one planet — the flat views are spherical projections; the ellipsoid lives in the geodesy and the measure tool.
  • Act III — your data. A layer stack you drag, fade and hide; GeoJSON, KML and three-file shapefiles read as one layer; any WMS, WMTS, XYZ or MVT service you can name. The dark wedges in the MODIS layer are real: one day of a polar orbit, and where two passes did not meet, nobody took a picture.
  • Act IV — compute on the globe. Ask the ground what elevation data exists there; contours at a typed 250 m; a hillshade that re-computes and re-drapes at about 70 ms per re-run while you are still holding the slider; a pipeline that forks into a graph.
  • Act V — scale. An export bigger than the screen; thirty days of the USGS catalogue replayed as a moving window — real data, replayed, not synthetic and not live.
  • Act VI — the world, live. Earthquakes as reported, severe-weather warnings over the radar that produced them, ships under way — whatever the feeds said that day. Then two that are not live, kept apart under their own cards: a satellite catalogue propagated by SGP4 from cached elements, and a modelled flood — a hydraulic model, not a real event — streamed zero-copy from a digital twin.

Recorded at 1920×1080/60 from the application itself. The recorder drives a virtual clock — the scene advances exactly 1/60 s per emitted frame — which is why the motion is unnaturally smooth. Nothing is composited over the footage except the title cards and the opening spec sheet.
The spec sheet

The film opens on a spec sheet — this is it, minus a tool count — and the acts that follow are the evidence for it.

> spec
Datum
WGS-84 ellipsoid · a = 6 378 137 m · geodetic ↔ ECEF in f64
Precision
relative-to-centre split-float — world space stays f64 until the subtraction
LOD
screen-space error over a quadtree descent · 256 px target
Depth
reverse-Z · Depth32Float · infinite far plane
Geodesy
Vincenty inverse · Karney polygon area
Picking
analytic ray ∩ ellipsoid
View
globe + five flat projections, switched live
GPU
Rust · wgpu · Vulkan or DX12, whichever wgpu picks on the machine
Data
XYZ · WMS · WMTS · MVT · 3D Tiles · glTF · GeoJSON · KML · Shapefile
Control
every layer, every panel, every colour
Agents
it can be flown by software — MCP tools for the suite's agent

Naming WGS-84 is table stakes; printing its semi-major axis is the claim that you implemented it. The flat projections use that axis as a sphere radius — the ellipsoid is in the geodesy and the measure tool, not the map projections.

What it is, why it exists, how it's built differently

Three short answers for the technical evaluator.

What it is

Seaglass Globe is a precision virtual globe: a WGS-84 ellipsoid held in double precision and rendered on the GPU through Rust and wgpu, with real elevation above and below the waterline, real imagery, and geodesy that names its algorithm. It is the Forge suite's optional 3D view — install it with the Seaglass Control Center and it starts alongside the engines.

Why it exists

The engines are headless, and ForgeGIS Studio is where a person operates them on a flat map — but some answers want the Earth. When the Globe is running it is the agent's presentation surface: ForgeMind's visual answers — contours, elevation profiles, draped rasters, scene entities — are drawn on the globe instead of only described. It has its own chat panel too, talking to the same agent.

How it's built differently

The numbers on screen are the render's own: precision held relative to the camera so a rooftop does not shimmer, a measurement that prints its method, a spec sheet with a semi-major axis on it. It reads what you already have — GeoJSON, KML, shapefiles, any tile service you can name — runs the suite's GPU compute engine, ForgeGIS, from a workflow editor docked under the map, and can be flown by software over MCP.

What's in the application

Beyond the film — the operator workstation, the compute surface and the agent surface, as documented in the Technical Brief.

The workstation

A docked workstation: Layers and Catalog on the left; Settings and Views on the right, joined by Entities, Assistant and Reports under the suite. Every panel docks in any region or tears off into its own operating-system window. A command palette (Ctrl+K) lists everything the application can do; Go to (Ctrl+G) searches your data. Four look axes — palette, surface, density, type — with Studio and Tactical presets. A project is a working directory: layers, view, panels, saved views, settings and workflows are small files written on change, so there is no Save.

Measure and coordinates

Nine measure modes — distance, path, area, bearing, slant range, circle, square, ellipse, quad — with the method named beside the number: Vincenty's inverse for distance and azimuth, Karney's for area, on the WGS-84 ellipsoid. Metric, US or nautical units switch live; paths run geodesic, rhumb or linear; freehand tracing; measurements save and load as GeoJSON. The cursor readout cycles decimal degrees, DMS, UTM and MGRS.

Your data

GeoJSON, KML/KMZ and three-file shapefiles with their attributes; XYZ, WMS 1.3.0, WMTS 1.0.0 and MVT sources added by URL, with a Discover step that reads a WMS or WMTS server's capabilities; glTF/GLB models and 3D Tiles. The layer stack reorders, hides, fades and promotes any layer to base, and persists between launches; click any feature and its attributes come back.

Compute on the globe

The Workflow editor is a node canvas over a real graph of ForgeGIS operations: drag ports to wire, pick up an edge to fork, add steps from a menu grouped by the engine's own categories. Every parameter gets a control built from the engine's schema; drag a number on a card and the result re-computes and re-drapes as you drag — on a branching document only the downstream part re-runs. Batch runs the chain over a folder; Contours draws labelled lines from the source; right-click the terrain and load DEM here fetches the best elevation data covering that point.

Catalog, entities and the agent

The Catalog panel browses what ForgeData knows about; one click drapes a raster and makes it the workflow's source. Draw a point, line or polygon and name it: it is a scene entity of the same kind the agent places, listed beside them, referenceable by name in chat, and — when the catalog is up — written through so it survives a restart with the same id. The Assistant panel is the conversation with ForgeMind; Reports show what it wrote.

Flown by software

One MCP endpoint on the running application — POST /mcp on loopback, bearer-protected in the suite — for camera, layers, projection, scene entities, reports, raster overlays and the full compute bridge: ForgeGIS operations, pipelines and batch; ForgeData catalog, elevation and publish. Clients attach to a running globe rather than launching one; compute tools return queued and the result lands on the globe a moment later; every object result also travels as structuredContent.

At a glanceSeaglass Globe 1.2.4
Data inXYZ · WMS 1.3.0 · WMTS 1.0.0 · MVT · 3D Tiles · glTF 2.0/GLB · Terrarium elevation · GeoJSON · KML 2.2/KMZ · Esri Shapefile (+DBF); the tile cache serves visited regions without a network
ProjectionsWGS-84 globe; five spherical flat views — equirectangular, Mercator, sinusoidal, orthographic, polar stereographic; independent map-view windows
Coordinates & measureDD · DMS · UTM · MGRS readouts; nine measure modes; Vincenty inverse and Karney area on the ellipsoid; metric, US, nautical; GeoJSON round-trip
ComputeForgeGIS operations, chains and graphs from a node-graph editor with live parameter scrubbing, batch, contours and load-DEM-here; ForgeData catalog, extraction, elevation and publish; results draped, drawn as entities, or reported
Agent surfacePOST /mcp on 127.0.0.1:7900 (configurable), MCP Streamable HTTP, bearer-authenticated per install; ForgeMind on 8080; engines over stdio
Digital twinSpec D wire client; Spec E shared-VRAM co-residency — opt-in, Vulkan-pinned, wire-only fallback
PlatformWindows x64 with a real GPU (Vulkan or DirectX 12 as wgpu selects); 8 GB RAM for the suite with the Globe installed; ~4 GB disk for a tile cache that grows with use

The Earth

The founding claim, and the one nothing else in the film makes: the same globe, at every altitude.

Oblique view across the Grand Canyon in Seaglass Globe: layered canyon walls in red, grey and green stepping down into shadowed side canyons, a forested rim toward the top of the frame, flat desert plateau to the horizon under a pale sky, with a scale bar and imagery credit strip along the bottom edge
An oblique look across the Grand Canyon: layered walls in red, grey and green stepping down into shadowed side canyons, a forested rim toward the top of the frame, and the plateau running out to a flat horizon under a pale sky. Bare globe — nothing drawn but the scene, a 2.1 km scale bar and the imagery credit along the bottom edge.
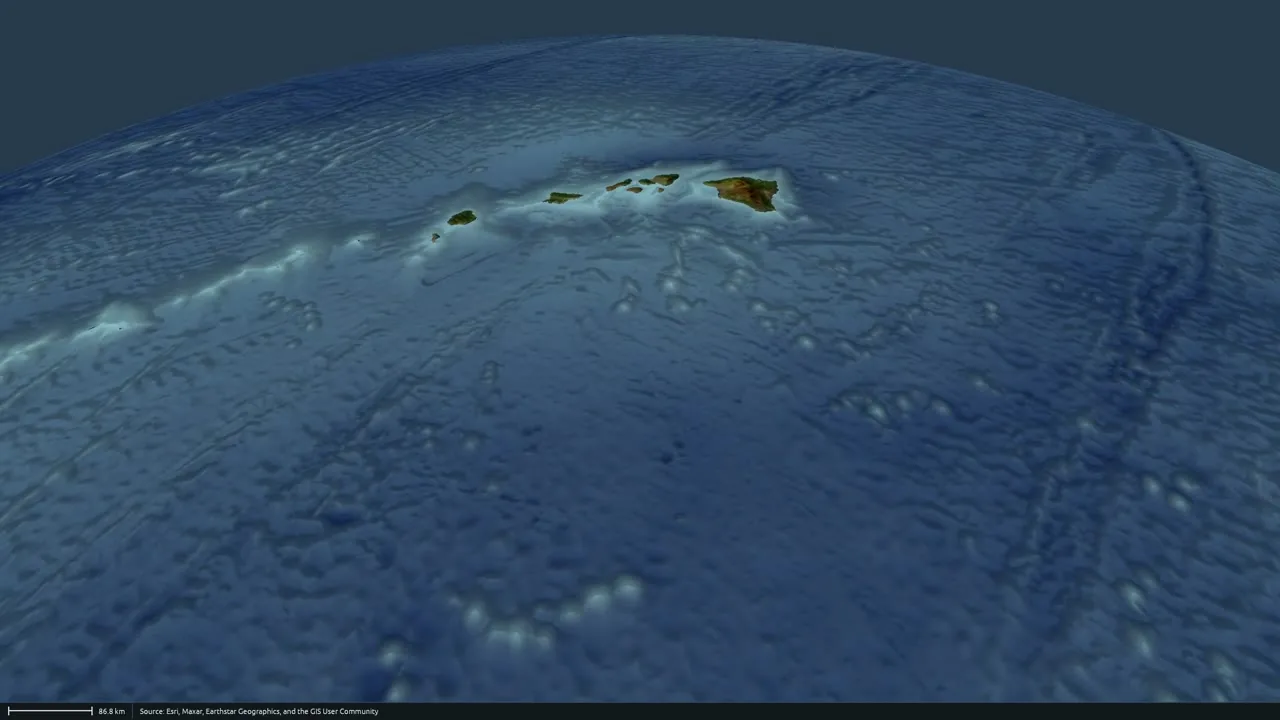
The Hawaiian island chain seen from altitude in Seaglass Globe: small green-brown islands on a blue ocean whose floor is shown in relief under a depth tint, with the Earth's curved limb against dark sky at the top and a scale bar and imagery credit strip along the bottom
The Hawaiian chain from altitude. The islands are the small green-brown shapes; everything else is seafloor — the ridge they sit on, the seamounts, the abyssal plain — in relief under the ocean-depth tint, with the Earth's limb against dark sky at the top and an 86.8 km scale bar bottom-left.

20 000 km → a rooftop · no cut

Twenty thousand kilometres to a rooftop, in one move. No cut, no dissolve, no swapping one scene for another — the same globe the whole way down. Precision is held relative to the camera, so the ground stops shimmering exactly where a single-precision engine starts to.

It doesn't stop at the waterline

Terrain doesn't stop at the waterline. Below it, the depth tint is reading the same elevation data as the mountains above — the ridge, the seamounts, the abyssal plain, in relief.

The shadows are where the depth is

Eighteen hundred metres of relief across sixteen kilometres, lit by the real sun at the real hour. The shading is not painted on: it is the light, the terrain, and the time of day.

It is a real coordinate system

A number without its method is not a measurement. Every measurement on the globe names the algorithm that produced it.

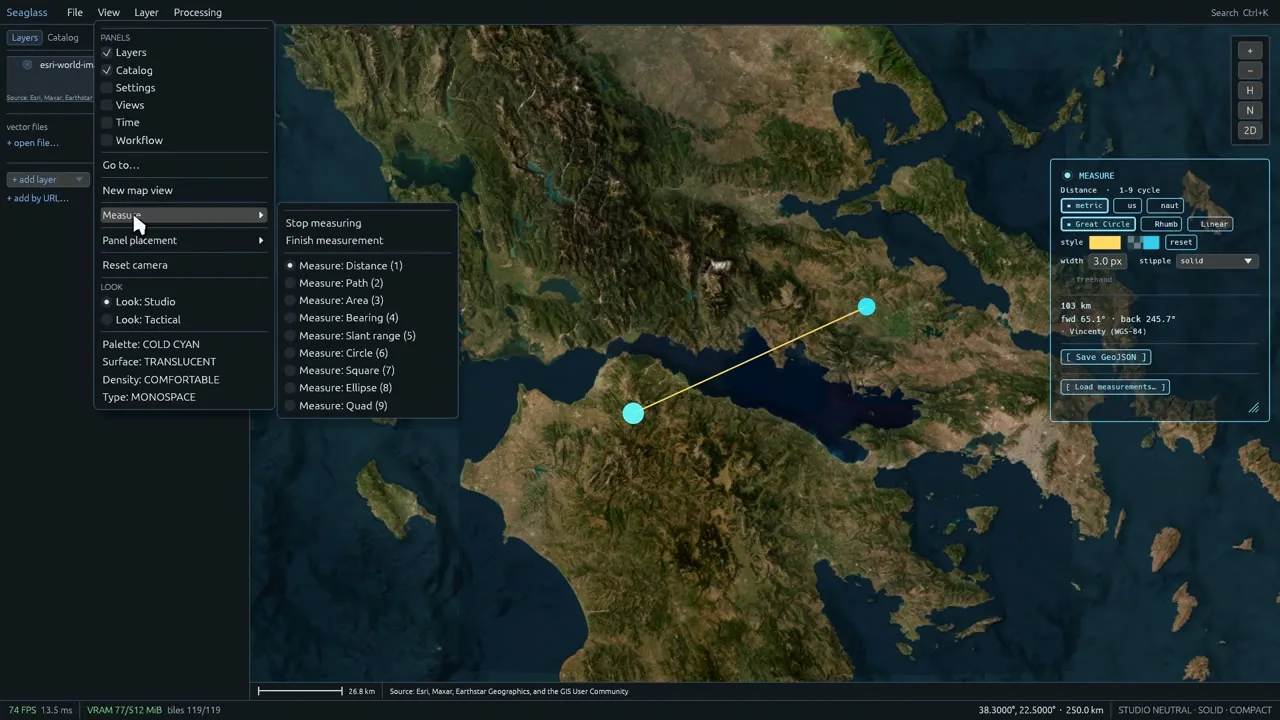
Seaglass Globe measuring across the Gulf of Corinth: the View menu open with Measure highlighted, a yellow line between two cyan points on the water, and the MEASURE panel on the right reading 103 km, forward azimuth 65.1 degrees, back azimuth 245.7 degrees, method Vincenty (WGS-84)
Two clicks across the Gulf of Corinth. The View ▸ Measure menu is still open on the left; the MEASURE panel on the right reads 103 km, forward azimuth 65.1°, back azimuth 245.7° — and the method badge: Vincenty (WGS-84).

The name of the algorithm

Two clicks on open water. Distance, forward azimuth, back azimuth — and the name of the algorithm that computed them: Vincenty's inverse solution, on the WGS-84 ellipsoid. Close a polygon and the method changes with the question. Area is Karney's, on the same ellipsoid.

The same point, four ways of writing it down

Decimal degrees, degrees-minutes-seconds, UTM, and the military grid reference the last one is built from — the status-bar readout re-forms each time. New York to Los Angeles bows north on the flat map, because on an ellipsoid that is the short way; the engine draws the geodesic, not the line that looks straight.

Flatten it, and come back

Globe plus five flat projections, switched live. Flatten it and the projection changes what you see without changing what is underneath; right-click the same screen position in each and it tells you where on the Earth that is. Come back to the globe and the camera never moved. The flat views are spherical projections — the ellipsoid lives in the geodesy and the measure tool.

Your data

Bring your own files and your own services. The layer stack is yours, and it survives the next launch.

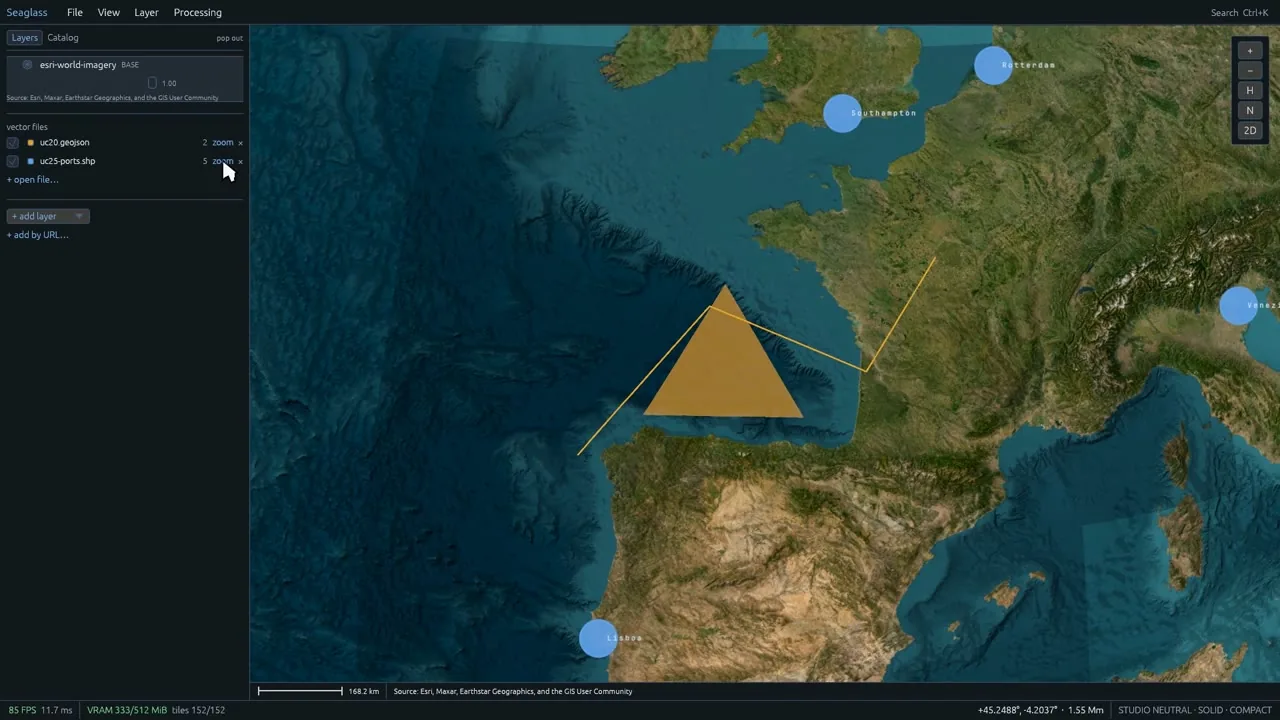
Seaglass Globe over western Europe with two vector files loaded: an orange filled triangle and a yellow line over the Bay of Biscay, blue circle markers labelled Rotterdam, Southampton and Lisboa, and the Layers rail on the left listing uc20.geojson and uc25-ports.shp
Two files on the layer stack — uc20.geojson and uc25-ports.shp — drawn over the base imagery of western Europe: an orange filled triangle and a yellow line over the Bay of Biscay, blue circle markers labelled Rotterdam, Southampton and Lisboa, and the Layers rail listing both files with their zoom and remove controls.
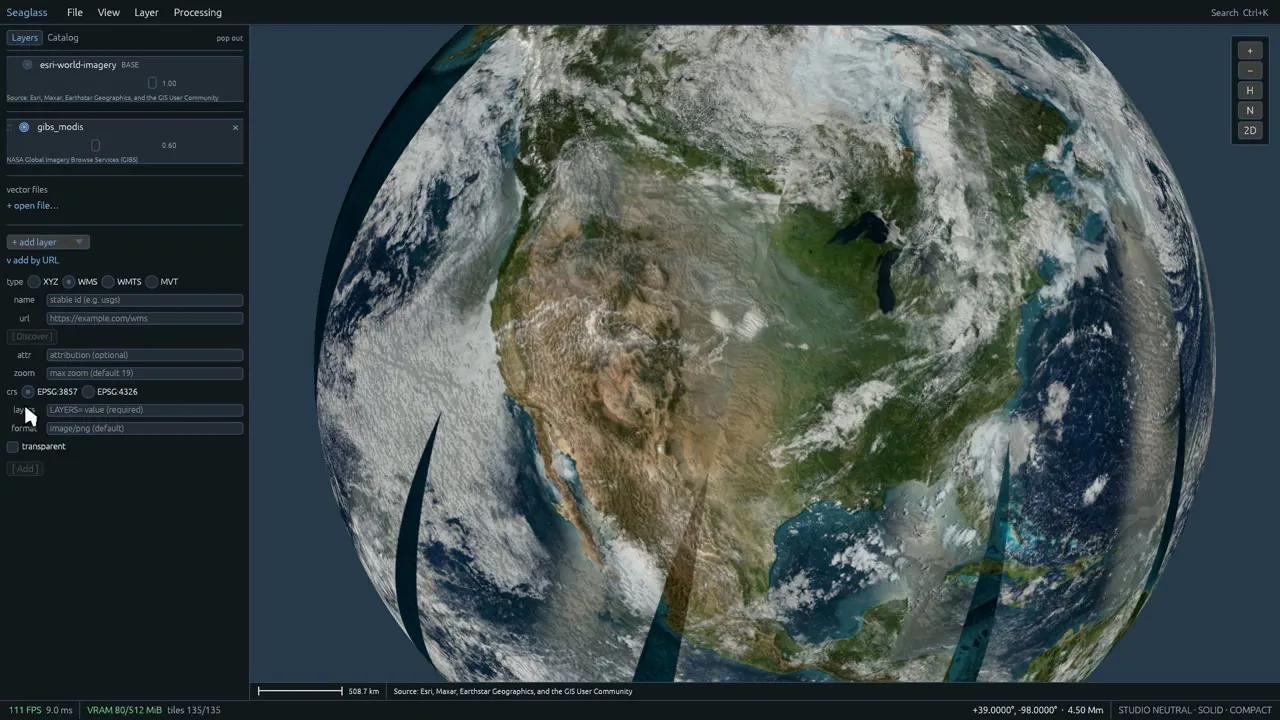
Seaglass Globe showing North America under a NASA GIBS MODIS true-colour cloud layer at 0.60 opacity, with dark curved swath gaps across the globe and the add-by-URL form open on the left offering XYZ, WMS, WMTS and MVT and a CRS choice
NASA GIBS MODIS true colour (layer gibs_modis, opacity 0.60) draped over the base imagery: North America under that day's real cloud. The dark curved wedges are not missing tiles — they are the gaps between passes of a polar-orbiting instrument's one-day swath. On the left, the add-by-URL form that fetched it: XYZ / WMS / WMTS / MVT and the CRS choice.

The stack is yours

A map is a stack, and the stack is yours. Drag one layer over another and the order is the order they draw in. Pull the opacity down and the layer beneath comes through. Hide it, and it is still there. The arrangement survives the next launch.

GeoJSON · KML · Shapefile

Bring your own data. GeoJSON, KML, shapefiles — the three-file kind, read as one layer. Click a feature and the attributes come back: the same table that was in the file, not a summary of it.

Any service you can name

Any tile service you can name — XYZ, WMS, WMTS, MVT. Point it at a standards server and it asks what that server has, then draws the layer you pick straight over the base imagery. The gaps are real: that is one day of a polar orbit, and where two passes did not meet, nobody took a picture.

Compute on the globe

The suite's GPU compute engine, run from a workflow editor docked under the map — and re-run while you are still holding the slider.

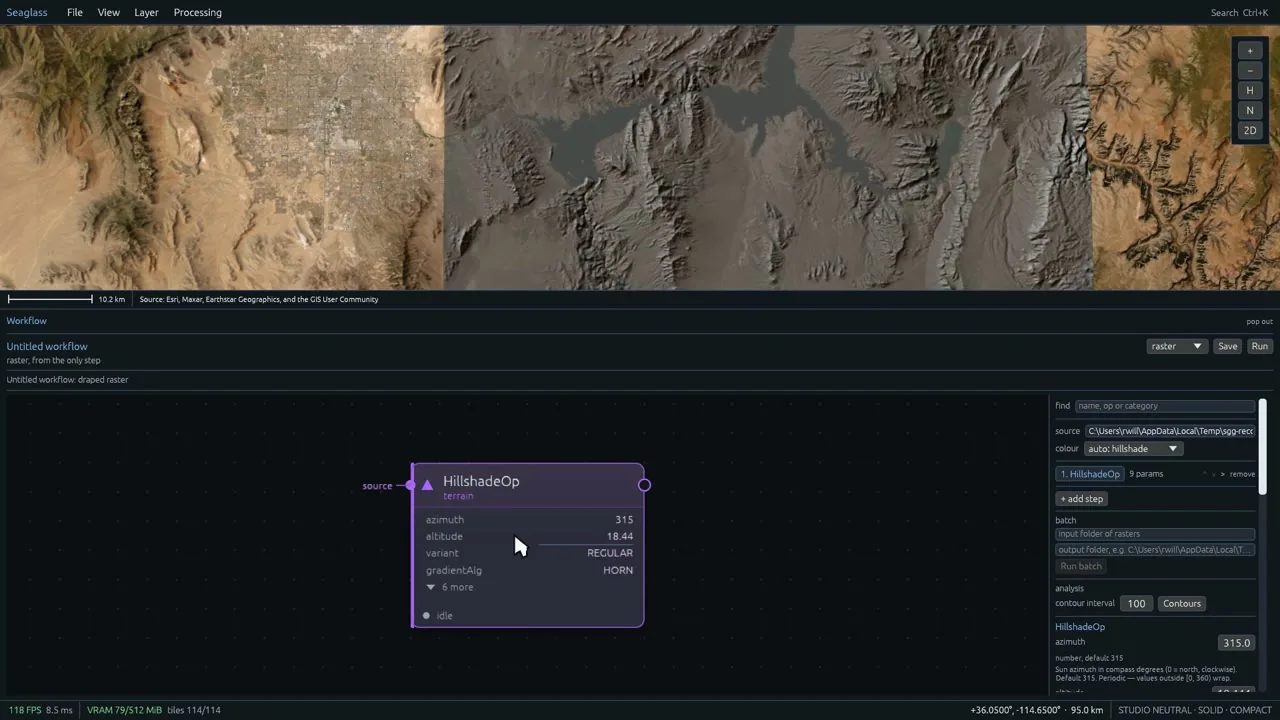
Seaglass Globe with the workflow editor docked under the map: a purple HillshadeOp card showing azimuth 315, altitude 18.44, variant REGULAR and gradient HORN with the pointer on the altitude row, a grey hillshade draped over the Lake Mead basin in the map band above with Las Vegas at the left, and a parameter rail on the right
The workflow editor docked under the map: a HillshadeOp card — azimuth 315, altitude 18.44, variant REGULAR, gradient HORN — with the pointer on the altitude row, and the hillshade draped over the basin in the map band above (Las Vegas at the left, Lake Mead at the centre). The right-hand rail carries the same step, its source raster, the auto: hillshade colour ramp, and a contour-interval field.

Ask the ground what it knows

Point at the ground and ask what elevation data exists there. It ranks what it can reach, cuts the window you asked for, and hands you a document with that file already set as its source — named, with its resolution, so “best available” is checkable rather than claimed.

Type a number · 250 m

Then type a number. Two hundred and fifty metres — a real interval against real elevation, and the labels are the elevations, not decoration.

~70 ms per re-run

Now change your mind. Drag the sun's altitude and the shading re-computes and re-drapes while you are still holding it — that is the engine running, the result coming back, and the globe re-texturing, for a value you have not let go of.

A pipeline is not always a line

Take an edge off, feed the same output into two branches, and it stops being a chain — so it runs as a graph.

The world, live

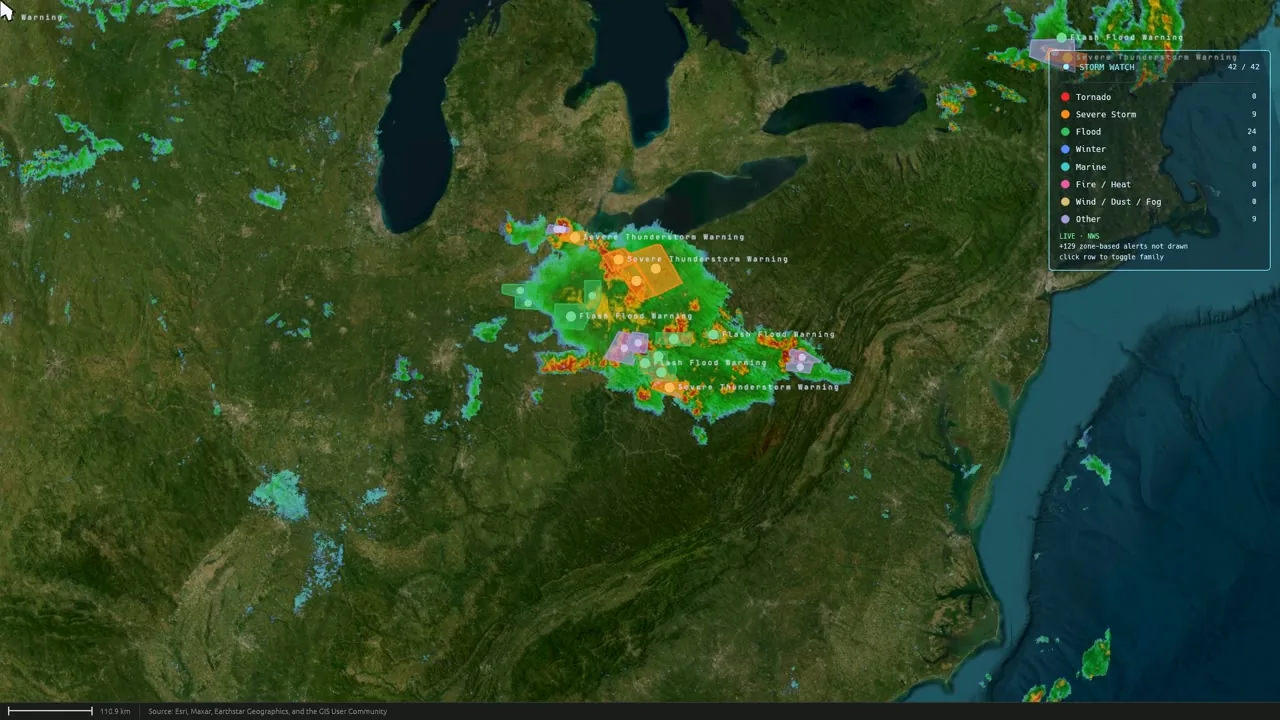
It does not have to be a file. Three feeds that are live — and two that are not, kept apart under their own cards.

Seaglass Globe over the eastern United States with a NEXRAD radar mosaic in green through red, warning polygons labelled Severe Thunderstorm Warning and Flash Flood Warning, and a STORM WATCH panel top-right listing alert families with a LIVE NWS badge beneath them
A snapshot of the feed on the day this frame was captured: the radar mosaic in green through red over the eastern United States, warning polygons labelled Severe Thunderstorm Warning and Flash Flood Warning by the Weather Service that issued them, and the STORM WATCH panel top-right tallying that day's active alerts by family, with a LIVE · NWS badge beneath them. Run it and the feed will say something else — the panel is the point, not the storm.
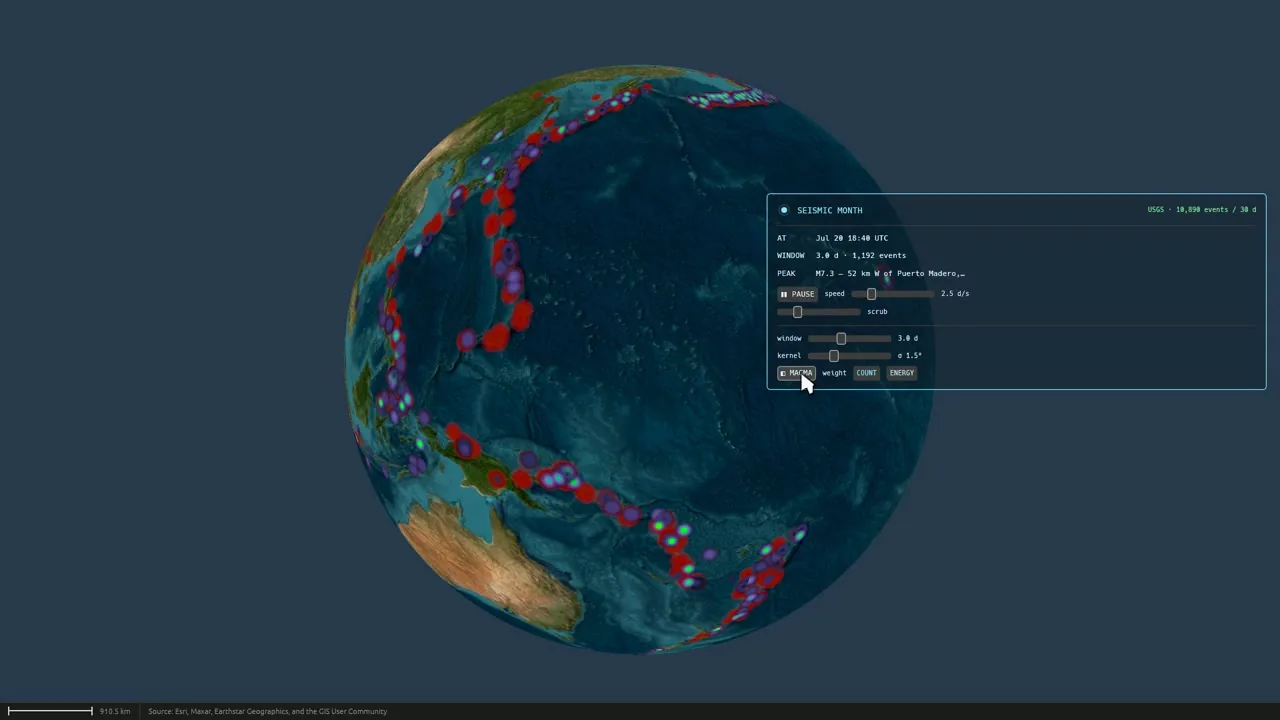
Seaglass Globe showing the Pacific with earthquake epicentres drawn as red, purple and green discs along the plate boundaries, and a SEISMIC MONTH panel on the right with the current instant, a 3.0-day window, playback speed, a scrub bar and a weight toggle
Thirty days of the USGS catalogue replayed as a moving window over the Pacific: epicentres drawn as discs along the plate boundaries, and the SEISMIC MONTH panel showing the current instant, a 3.0-day window, playback at 2.5 days per second, the scrub, and the weight toggle. Real data, replayed — not synthetic, and not live.

Three feeds, live

Earthquakes as reported, sized by magnitude and coloured by how deep they were. Severe-weather warnings as the Weather Service issued them, over the radar that produced them. Ships under way, reporting themselves. Each shows whatever its feed says the day you run it.

A month, measured

A month of earthquakes, and every one of them measured. Thirty days of the USGS catalogue, replayed as a moving window — real data, replayed; not synthetic, and not live seismicity.

SGP4 — propagated, not live

A whole catalogue of orbits, propagated from real elements by SGP4 — and sorted, so you can take a whole shell out of the sky and put it back. The catalogue is cached and the propagation is genuine — propagated, not live, and the narration says so.

Digital twin · zero-copy

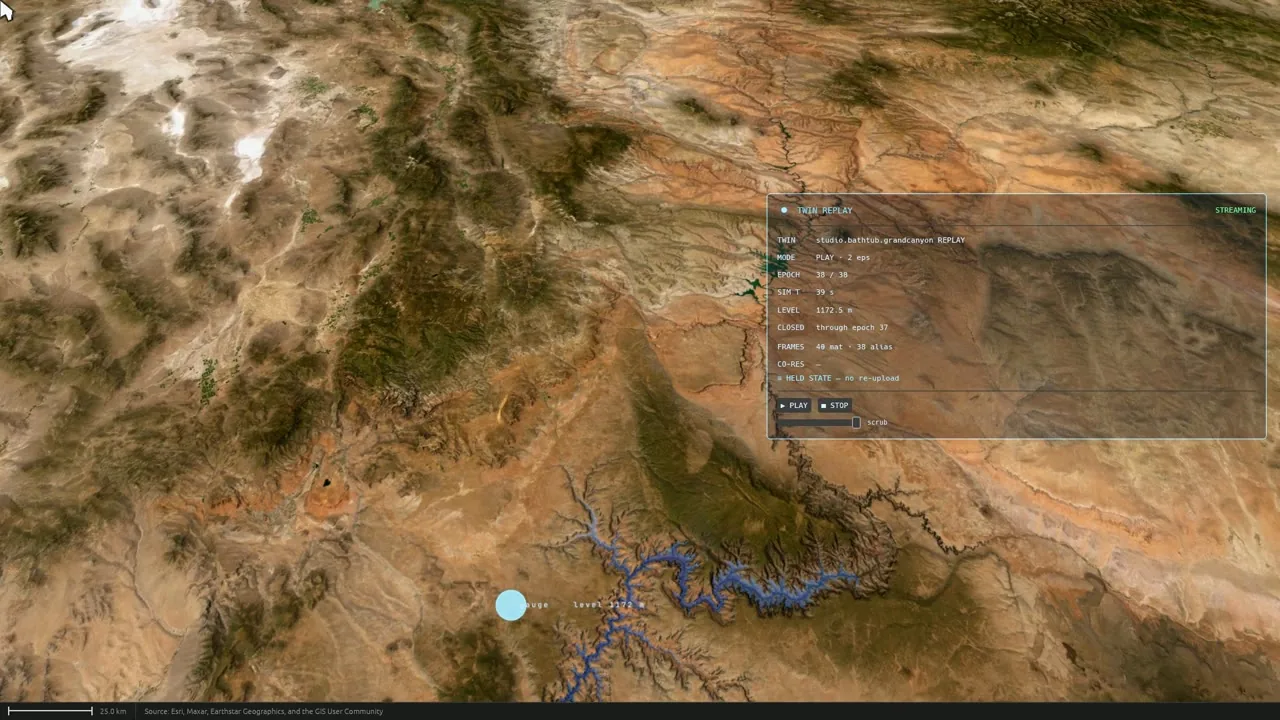
The last demonstration in the film: a modelled flood, streaming from a ForgeGIS digital twin straight into shared video memory.

Seaglass Globe replaying a modelled flood over the Grand Canyon: blue water drawn along the canyon, a cyan gauge marker labelled level 1172 m, and a TWIN REPLAY panel reading STREAMING, twin studio.bathtub.grandcanyon REPLAY, mode PLAY 2 eps, epoch 38 of 38, level 1172.5 m, and CO-RES HELD STATE no re-upload
A modelled flood, not a real one: the studio.bathtub.grandcanyon replay at epoch 38 of 38, the water drawn in blue along the canyon at level 1 172.5 m with a gauge marker labelled level 1172 m, and the TWIN REPLAY panel reading STREAMING, PLAY · 2 eps, and CO-RES ≡ HELD STATE — no re-upload.

A modelled flood, streaming from a digital twin

A hydraulic model — not a real event — replayed over a wire at an accelerated pace, straight into shared video memory. The Globe is the remote consumer of the twin's published wire contract: it never embeds the engine, and it renders live and replayed runs the same way, because a replay is indistinguishable from live by design.

We pin Vulkan for this one

In co-resident mode — on a large-VRAM workstation, and off by default — the adapter is pinned to Vulkan so the twin's memory can be imported rather than copied: the globe samples it where it already sits. Meaning and the durable record still travel the normal path.

Where the Globe sits in the Forge suite

Optional, opt-in, and the agent's presentation surface. Everything runs locally: the Globe's API, like the agent's, is bound to loopback and protected by a per-install token.

The presentation surface

When it's running, answers that produce something visual — contours, elevation profiles, draped rasters, scene entities — get drawn on the globe instead of only described. Ask the agent from the Control Center, from Studio, or from the Globe's own chat panel; it is the same agent either way.

Launch order matters

Start suite launches the Globe first, so the agent adopts it as its drawing surface, then ForgeMind — which spawns ForgeGIS and ForgeData as tool servers — then Studio. Start the Globe after ForgeMind and you restart ForgeMind: it picks its drawing surface at launch.

It needs a real GPU

A hardware-accelerated globe you can fly around — and an RDP or remote-desktop session usually can't drive it. Leave the window open and unminimized while the agent works: minimized, it stops rendering and drawing requests time out.

ComponentRolePort
ForgeMind Agent orchestrator (HTTP + MCP host); spawns the others 8080 loopback
ForgeGIS GPU geospatial compute engine (MCP stdio child) stdio
ForgeData Dataset catalog + ingesters (MCP stdio child) stdio
ForgeGIS Studio (opt-in) Web workspace for building and running pipelines 8081 loopback
Seaglass Globe (opt-in) The 3D view and the agent's presentation surface; runs its own copy of the GIS engines 7900 loopback + bearer

The suite wants 8 GB of RAM with the Globe installed (4 GB without) — it runs its own copy of the GIS engines, and the Control Center caps each service's heap from your machine's RAM and re-plans it when the Globe is installed.

A note on licensing. Seaglass Globe is an opt-in component of the Forge suite, installed by the Seaglass Control Center, and is not sold separately. The Forge suite is commercially licensed; terms are provided on request, and evaluation builds are available to qualified teams — see how to evaluate.

Downloads

All Seaglass Globe collateral, v1.2.4. Direct download — no email gate, no form wall.

The Globe is an opt-in component of the Forge suite and is not sold separately; see the licensing note above.

Data & imagery

Attribution is burned into every frame of the film and every still on this page — never covered, never cropped. In legible form:

Imagery: © OpenStreetMap contributors · Esri, Maxar, Earthstar Geographics, and the GIS User Community · © CARTO · Mapzen Terrain Tiles, hosted by AWS Open Data · NASA Earth Observatory · NASA GIBS.
Data: USGS · NOAA/NWS · Iowa Environmental Mesonet NEXRAD · Digitraffic (Finnish Transport Infrastructure Agency) · CelesTrak.
Type in the application: JetBrains Mono, SIL Open Font License 1.1.

Evaluate the Forge suite — with the Earth in the room

Run the whole suite on one Windows x64 workstation with a real GPU, and watch the agent draw its answers on the globe. Seaglass Foundry reads every email.

rich@seaglassfoundry.com